Overview
Employee health is not just a “benefit”
Section titled “Employee health is not just a “benefit””It is a business reality. Over the past few years, the way we work has fundamentally changed. Teams are distributed, expectations are higher and the lines between work and life are increasingly blurred. In this environment, employee health (physical, mental and emotional) has emerged as one of the most critical factors shaping productivity, retention and long-term growth.
The Employee Health Matters Handbook is Pazcare’s attempt to move this conversation beyond assumptions and anecdotes. It is built on real-world data drawn from over 89,000 claims and health check-ups of employees and organizations across India, capturing how today’s workforce uses health benefits, where gaps exist and what modern teams truly need to stay healthy at work.
Employees are engaging more with healthcare, expectations from employers are rising and traditional approaches to employee benefits are no longer enough. Companies that treat employee health as a checkbox risk falling behind. Those that see it as a strategic priority will build stronger, more resilient teams.
Sanchit Malik, Co-Founder & CEO
Foreword
Section titled “Foreword”There is a grey area between health and disease which has to be addressed to keep the workforce in good health and gain maximum productivity.
Over five decades of my clinical practice, which included the privilege of serving as physician to the highest offices in the country, I have observed a consistent truth: disease does not begin at the point of diagnosis. It evolves silently over years, shaped by lifestyle, environment and daily choices. This needs to be carefully tackled in a useful and productive manner.
What makes this handbook particularly relevant is the clarity with which it brings that silent progression to light. The data is both compelling and concerning. Nearly 7 out of 10 employees carry at least one lifestyle-related health risk. Even more striking, almost half of male employees under the age of 35 already show abnormal blood pressure levels, and by the age of 31 to 35, one in four demonstrates early disruption in long-term blood sugar control. Add to this weight gain, fatty liver and a rise in cholesterol. These are not isolated findings; they represent a mosaic of metabolic drift emerging far earlier than we traditionally expect.
Equally important is the overlap of these risks, which keeps happening in the grey zone. A significant proportion of younger employees are not dealing with a single abnormal parameter, but multiple simultaneous markers that together form the foundation of future chronic disease. This is the stage at which intervention is most effective, yet it is also the stage most often ignored, and it is more significantly reversible if dealt with at this stage.
The report also highlights how healthcare costs are not driven by isolated events alone. Maternity, for instance, accounts for nearly 20 percent of all claims, with a rising proportion of high-intervention deliveries. At the same time, dependents, particularly parents, contribute disproportionately to high-value claims, reflecting the full progression of the same metabolic conditions now being detected early in employees. This saves a lot of revenue and reimbursement costs.
For corporate leaders, these insights must prompt a shift to an employee-friendly approach. Workplace health can no longer remain a reactive function driven by hospitalizations and high insurance costs. It must be viewed as a continuum, where early detection, optimal timely intervention and sustained engagement define both health outcomes and organizational performance.
In my association with Twin Health, I have seen the impact of addressing metabolic health at its root, rather than managing its complications. The emphasis on reversing early metabolic dysfunction, rather than waiting for disease to manifest, represents a necessary and overdue shift in how we approach employee health individually.
I commend Pazcare for developing a handbook that moves beyond observation to actionable insight. It is my hope that this work encourages HR leaders and decision-makers to act earlier, think structurally and recognize that investments in employee health are, in fact, investments in long-term organizational strength and resilience. These investments are real-time savings.
Dr Mohsin Wali, Principal Director, Medicine & Preventive Cardiology, Pacific One Health.
Dr Wali is a distinguished Indian cardiologist and former Honorary Physician to the Presidents of India, having served R. Venkataraman, Shankar Dayal Sharma and Pranab Mukherjee, the only doctor to have held this distinction. A recipient of the Padma Shri in 2007, he is currently a Senior Consultant at Sir Ganga Ram Hospital, New Delhi, and a respected voice in preventive and metabolic health. Dr Wali also serves on the advisory board of Twin Health, contributing his decades of clinical experience to advancing chronic disease prevention in India.
Why does employee health data matter for HR and founders?
Section titled “Why does employee health data matter for HR and founders?”Most of the conversations we have about employee health begin only after something has happened.
A hospitalization triggers concern. A rising claim cost triggers policy review. A spike in sick leave triggers debate about workload.
What often goes unnoticed is the quiet, steady drift that happens long before any of these visible signals appear.
Health issues rarely announce themselves. They build slowly. A little less sleep each week. Slightly higher blood pressure at one screening. A glucose number that is “not alarming but worth watching.” A parent who needs regular cardiac medication. A few more employees mentioning fatigue. Alone, these moments feel ordinary. Together, they tell a different story; one that eventually surfaces as missed deadlines, reduced concentration, unplanned absences and benefit costs that keep climbing without an obvious cause.
This handbook exists to bring that story into focus.
It reflects thousands of decisions employees make every day. These choices shape the health of an organization far more than any single event and they shape its performance in equal measure. A workforce carrying unmanaged chronic conditions, undetected nutritional deficiencies, or untreated mental health stress is not performing at its potential. The gap between the workforce you have and the workforce you could have is, in large part, a health gap.
In the coming chapters, you will see how small biological changes begin to cluster, how mental and physical health reinforce each other, why dependents play such a significant role in claim patterns and how organizations can intervene at the right moments. You will also see where prevention is working, where it breaks down and where simple structural changes can redirect the entire arc of long-term cost and long-term performance.
Think of this report not as a snapshot, but as a lens through which to view the work world. It shows what is shifting beneath the surface today and what those shifts mean for the next year, the next budget cycle and the next generation of employees.
We help India’s companies protect their people. We turned our own claims and health check-up data into insights that show how employees are actually doing. This is not just about diseases or numbers. It is about what the data says about how modern work is affecting health, what problems are emerging quietly and how HRs and founders can respond early, before a health issue becomes a hospitalization and before a hospitalization becomes a business problem.
Methods and data sources
Section titled “Methods and data sources”We relied on two primary data sources for this handbook:
- Claims across 400K lives in 5 years
- 77K
- Health check-ups analyzed
- 12K
These were supplemented by secondary research on the latest science about various systems and diseases of the body.
Methods
Section titled “Methods”All data has been anonymized at source during extraction from primary systems, with no personally identifiable information extracted. Extracted data has been aggregated for calculation of summary metrics. Data has been securely destroyed using Windows cipher.
The claims data was converted into relative metrics of incidence (for example, the percentage of people in a population who had a claim) and share (for example, the percentage of claims due to a specific reason), by volume of claims and by value of the medical expense associated with the claims, where relevant. Health check-up data was extracted directly in the form of the percentage of the base with test values outside the normal range.
The effect of age and gender has been considered in the analysis: comparisons have been made where the age and gender distribution is similar, or for similar sub-sets.
Comparisons have been made only where we have a minimum sample size of 1,000 observations for a metric.
Executive summary
Section titled “Executive summary”- Employees carry at least one lifestyle-related health risk
- 7 in 10
When we look across the full spectrum of employee and dependent health and claims data for 2025, three themes stand out. They appear in different forms across claims, screenings and demographic patterns, but together they create a clear picture of where workforce health is headed and what leaders need to prepare for.
How much do maternity claims cost in India, and why are C-sections rising?
Section titled “How much do maternity claims cost in India, and why are C-sections rising?”Across industries and company sizes, maternity consistently accounts for a significant share of total medical claims. It often represents up to 20% of total group health claims for the 25 to 35 age demographic. This maintains a consistent trajectory that allows for precise long-term financial forecasting.
But predictable doesn’t mean flat. Normal delivery costs have grown 18% over the past three years, from ₹55,000 to ₹65,000. Metro cities like Bangalore, Mumbai, Delhi, Hyderabad, Chennai and Pune show even sharper inflation. Normal delivery costs in metros now average ₹75,000, a 42% premium over non-metro areas at ₹53,000. For C-sections, costs in metro cities average ₹83,000 vs ₹56,000 in non-metros; a 48% premium. In the most extreme comparison, a metro C-section vs a non-metro normal delivery, the cost gap reaches 1.6x.
Average delivery cost, metro vs non-metro
- Metro cities
- Non-metro
View as table
| Category | Metro cities | Non-metro |
|---|---|---|
| Normal delivery | ₹75,000 | ₹53,000 |
| C-section | ₹83,000 | ₹56,000 |
What is more important is the pattern behind those numbers. The real cost driver isn’t normal deliveries; it’s C-sections. With 62% of deliveries now C-section and costs running 1.28x higher than normal births on average, the majority of maternity spending flows to high-risk, high-intervention cases.
For organizations, this data is vital for budgeting and policy design, but it also reveals a sobering reality: C-sections alone account for an estimated 77% of all delivery costs in this portfolio. With employees delaying childbirth, many women are entering maternity at an age where physiological resilience is lower and metabolic risk is higher.
Younger employees are developing early metabolic and lifestyle-related risks
Section titled “Younger employees are developing early metabolic and lifestyle-related risks”This is the quiet trend that deserves the most attention.
Consider a 29-year-old software developer, no diagnosed conditions, no medications, no hospital visits. Outwardly healthy. But their health screening tells a different story: abnormal blood pressure, low good cholesterol, elevated blood sugar markers and early liver irregularities. Not one red flag but four. And they have no idea.
Our screening data paints a consistent picture across every metabolic marker: risk is not waiting for age 40.
How common is high blood pressure in young Indian employees?
Section titled “How common is high blood pressure in young Indian employees?”Nearly half of male employees under 35 show abnormal blood pressure readings. These are not borderline readings in a handful of cases. This is every second young male employee walking around with elevated blood pressure and, in most cases, no awareness of it.
Abnormal systolic blood pressure, by age
- Male
- Female
View as table
| Category | Male | Female |
|---|---|---|
| Under 25 | 49% | 50% |
| 25–30 | 44% | 30% |
| 30–35 | 48% | 11% |
| 35–40 | 50% | 67% |
| 41+ | 48% | 0% |
Abnormal diastolic blood pressure, by age
- Male
- Female
View as table
| Category | Male | Female |
|---|---|---|
| Under 25 | 44% | 38% |
| 25–30 | 32% | 40% |
| 30–35 | 38% | 11% |
| 35–40 | 50% | 67% |
| 41+ | 57% | 0% |
At what age do blood sugar abnormalities start in employees?
Section titled “At what age do blood sugar abnormalities start in employees?”Males show persistently high abnormal rates across all age groups. Fasting blood sugar abnormalities double every five years in males. HbA1c, the three-month blood sugar average and the more definitive pre-diabetes marker, tells a sharper story. By age 31 to 35, more than 1 in 4 males show HbA1c abnormalities, indicating sustained glucose dysregulation, not just a one-time spike.
Abnormal HbA1c, by age
- Male
- Female
View as table
| Category | Male | Female |
|---|---|---|
| 25 and under | 7% | 14% |
| 26–30 | 15% | 12% |
| 31–35 | 27% | 17% |
| 36–40 | 31% | 27% |
| 41+ | 53% | 55% |
Abnormal fasting blood sugar, by age
- Male
- Female
View as table
| Category | Male | Female |
|---|---|---|
| 25 and under | 3% | 3% |
| 26–30 | 6% | 4% |
| 31–35 | 12% | 7% |
| 36–40 | 18% | 17% |
| 41+ | 38% | 37% |
These are not diabetic employees, yet. But 1 in 8 males aged 31 to 35 already show abnormal fasting glucose. 1 in 4 show abnormal HbA1c.
Which age group has the most cholesterol problems?
Section titled “Which age group has the most cholesterol problems?”Employees aged 20 to 35 account for 63% of all lipid problems; more than double the 41+ group at 27%.
- Low HDL (good cholesterol): the number one abnormal marker, at 28% of all lipid flags in under-35s
- Elevated LDL (bad cholesterol): 15% of flags, worsening from 20–30 to 31–35
- Poor cholesterol ratios: 29% of all lipid flags, and the earliest warning of artery damage
- Triglyceride imbalance: males show 2.5x the abnormal rate of females
- Liver stress: males account for 75% of liver flags, typically fatty liver, not alcohol
How common are thyroid abnormalities among women employees?
Section titled “How common are thyroid abnormalities among women employees?”By age 31 to 35, 1 in 5 women have abnormal TSH.
Thyroid dysfunction directly compounds every other metabolic risk; it impairs lipid metabolism, glucose regulation and weight management, making every other marker harder to control.
Abnormal TSH, by age
- Female
- Male
View as table
| Category | Female | Male |
|---|---|---|
| 25 and under | 16% | 15% |
| 26–30 | 19% | 14% |
| 31–35 | 21% | 12% |
| 36–40 | 22% | 15% |
| 41+ | 25% | 16% |
Abnormal T4 and T3, by age
- T4 male
- T4 female
- T3 male
View as table
| Category | T4 male | T4 female | T3 male |
|---|---|---|---|
| 25 and under | 3% | 3% | 1% |
| 26–30 | 4% | 3% | 2% |
| 31–35 | 4% | 5% | 2% |
| 36–40 | 7% | 4% | 2% |
| 41+ | 5% | 5% | 1% |
WBC: immune function baseline
Section titled “WBC: immune function baseline”WBC abnormalities remain relatively stable across age groups (4 to 9%), suggesting immune function is not yet compromised. But when combined with rising metabolic dysfunction, impaired immunity becomes a compounding risk; metabolically stressed employees recover slower and get sicker longer.
Abnormal WBC, by age
- Male
- Female
View as table
| Category | Male | Female |
|---|---|---|
| 25 and under | 5% | 8% |
| 26–30 | 4% | 9% |
| 31–35 | 5% | 7% |
| 36–40 | 8% | 7% |
| 41+ | 5% | 7% |
What is the risk of multiple health markers at once?
Section titled “What is the risk of multiple health markers at once?”62% of employees aged 20 to 35 with any lipid abnormality carry two or more simultaneous markers. 37% carry three or more. The overlap worsens with age within this group, and males are hit harder at 66.5% vs 55.3% for females.
Employees aged 20 to 35 with a lipid abnormality who carry several markers
View as table
| Category | Share of employees |
|---|---|
| 2+ simultaneous lipid markers | 62% |
| 3+ simultaneous lipid markers | 37% |
| Male with 2+ markers | 66.5% |
| Female with 2+ markers | 55.3% |
Now layer the full picture. A male employee aged 31 to 35 has:
- 48% chance of abnormal systolic blood pressure
- 27% chance of abnormal HbA1c
- 12% chance of abnormal fasting glucose
- 68% chance of multiple cholesterol markers (if any lipid flag exists)
These are not separate risks. They are the overlapping components of metabolic syndrome appearing a full decade before clinical disease typically manifests.
This pattern is shaped by work environments: long sedentary hours, convenience-driven food, irregular sleep from hybrid schedules and chronic stress. These are workplace conditions, not personal failings, which means they are modifiable.
Why do dependents drive the highest-cost health claims?
Section titled “Why do dependents drive the highest-cost health claims?”This is one of the most misunderstood aspects of corporate health. Employees are often seen as the primary beneficiaries of group insurance. In reality, the highest-cost claims come from dependents, especially parents, who require:
- Cardiac surgery
- Renal treatment
- Cancer treatment
- Chronic disease management
- Cataract procedures
These events are medically necessary, often unavoidable and predictably expensive. What is striking is the symmetry: the same metabolic patterns now visible in employees are the fully developed versions of what their parents are being treated for. It is a mirror. And mirrors in health data are meaningful. They show the trajectory employees may follow without early intervention.
If there is one place where organizations consistently lose value, it is in the gap between detection and action. Employees complete their annual health checks. They receive a report with abnormalities marked in yellow or red. Then, for many, nothing happens. No follow-up consultation. No lifestyle adjustment. No structured next steps.
The organizational impact
Section titled “The organizational impact”These insights are more than medical patterns. They directly influence:
- Premiums and renewal negotiations
- Workforce productivity
- Absenteeism trends
- Leadership bandwidth
- Employee morale
- Long-term financial stability
In the upcoming chapters, we break down:
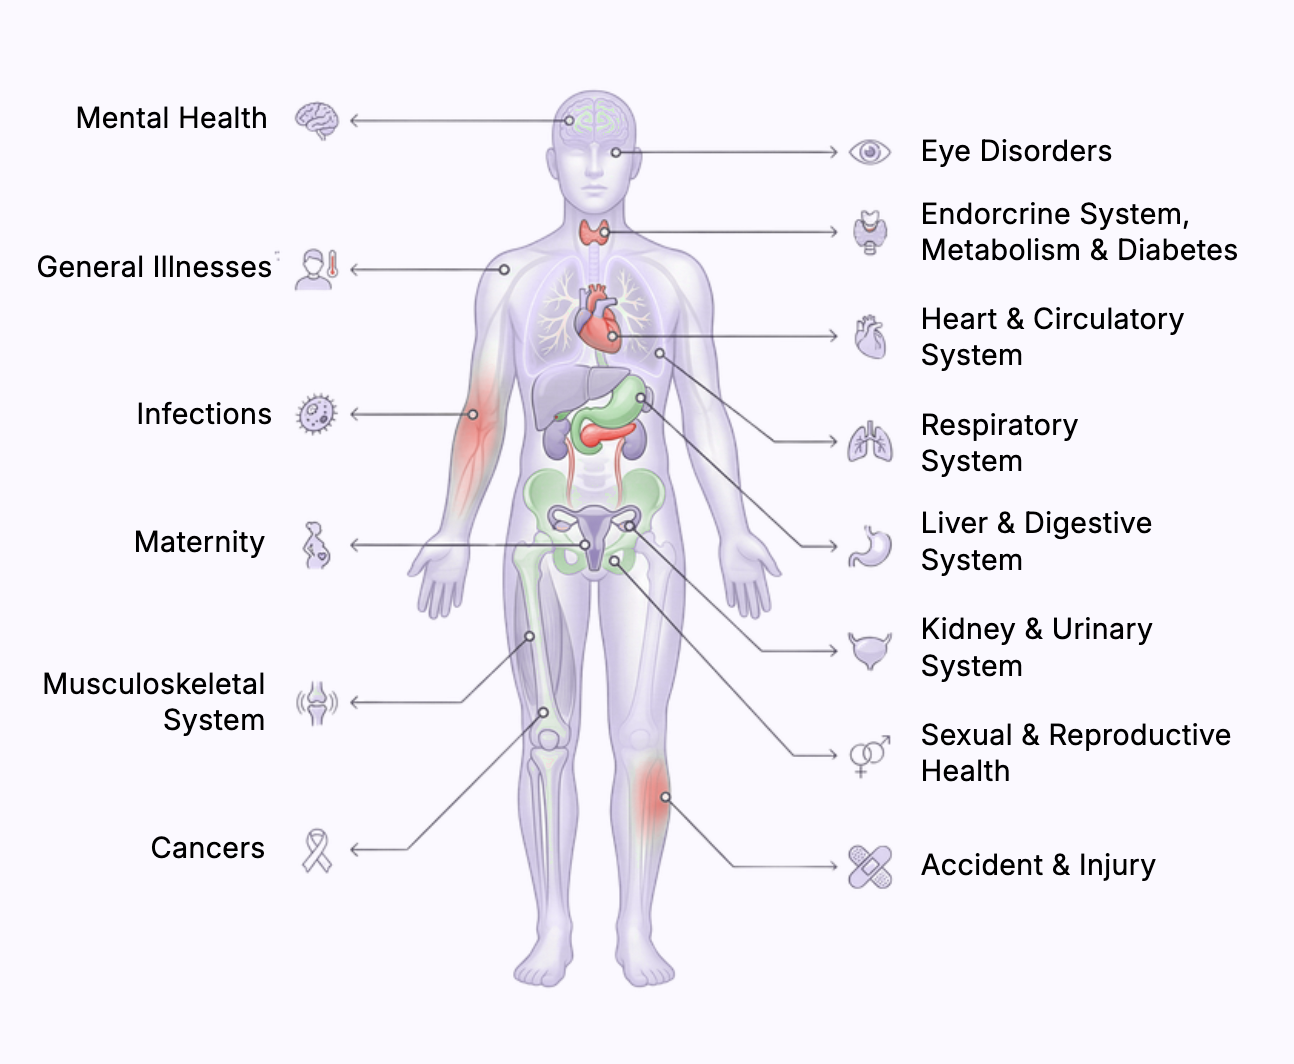
Section titled “In the upcoming chapters, we break down:”- How maternity, injuries, infections and other conditions behave differently
- Which conditions are rising
- Where identification is easiest
- Where structural gaps increase risk
- How metabolic, mental and lifestyle pressures interact
- Which younger employees are developing the markers that become diabetes, heart disease and hypertension
- What organizations must do to intervene early
- Which metrics determine long-term success
The 360° view of workplace health
Section titled “The 360° view of workplace health”Workplace health isn’t just one number or statistic; it’s a complex, interconnected web. To really understand and support employees, leaders need to see the full picture: many different factors coming together, each one affecting the others.
Physical and mental health: the two sides of the same coin
Section titled “Physical and mental health: the two sides of the same coin”When we think about health at work, we usually start with the basics: how people feel physically and how they’re doing mentally. This handbook explores both sides: looking at chronic health issues that often go unnoticed but add up to higher costs, as well as the mental health struggles that are becoming more common. The truth is, you can’t fully understand one without the other; together, they shape your team’s true health.
Health progression lens
Section titled “Health progression lens”Health isn’t black and white; no one goes from perfectly fine to seriously ill in an instant. There’s a whole range, starting with early warning signs and everyday risks, then moving through ongoing health issues and sometimes leading to more serious illness. It’s important for leaders to pay attention to this journey.
Interconnectedness
Section titled “Interconnectedness”What really makes workplace health complicated is that these different parts aren’t separate; they’re all connected. One problem can lead to another: for example, a physical injury might make it hard to move, which can take a toll on mental health, which then affects how people work and get along with others. Mental health issues can also show up in surprising ways, making other health problems worse. The numbers always tell the same story: health challenges overlap and build on each other and it’s never as simple as a single score.
What drives health in the first place
Section titled “What drives health in the first place”Beneath everything else, there’s a deeper layer that’s tough to track but makes a huge difference: things like social connections, the work environment and company culture. Money worries, feeling isolated at work, or working in a stressful space can all shape how healthy people really are, even before any symptoms appear. Leaders who pay attention to these underlying factors have a real chance to make a positive impact, helping people stay well instead of just reacting to problems when they get bigger.
The challenge for people leaders
Section titled “The challenge for people leaders”Looking at workplace health from every angle isn’t easy. It means going deeper than the usual numbers, connecting the dots between physical and mental health, catching early signs before they become bigger issues and building a positive culture and environment that supports people for the long haul.
What this report covers
Section titled “What this report covers”The next sections give you a solid starting point. First, we look at the physical and mental health trends affecting today’s workforce, and then at how health can change over time, from early warning signs to serious illness. These are the areas where the data is most clear and where you can take action that truly makes a difference.